Dynamic
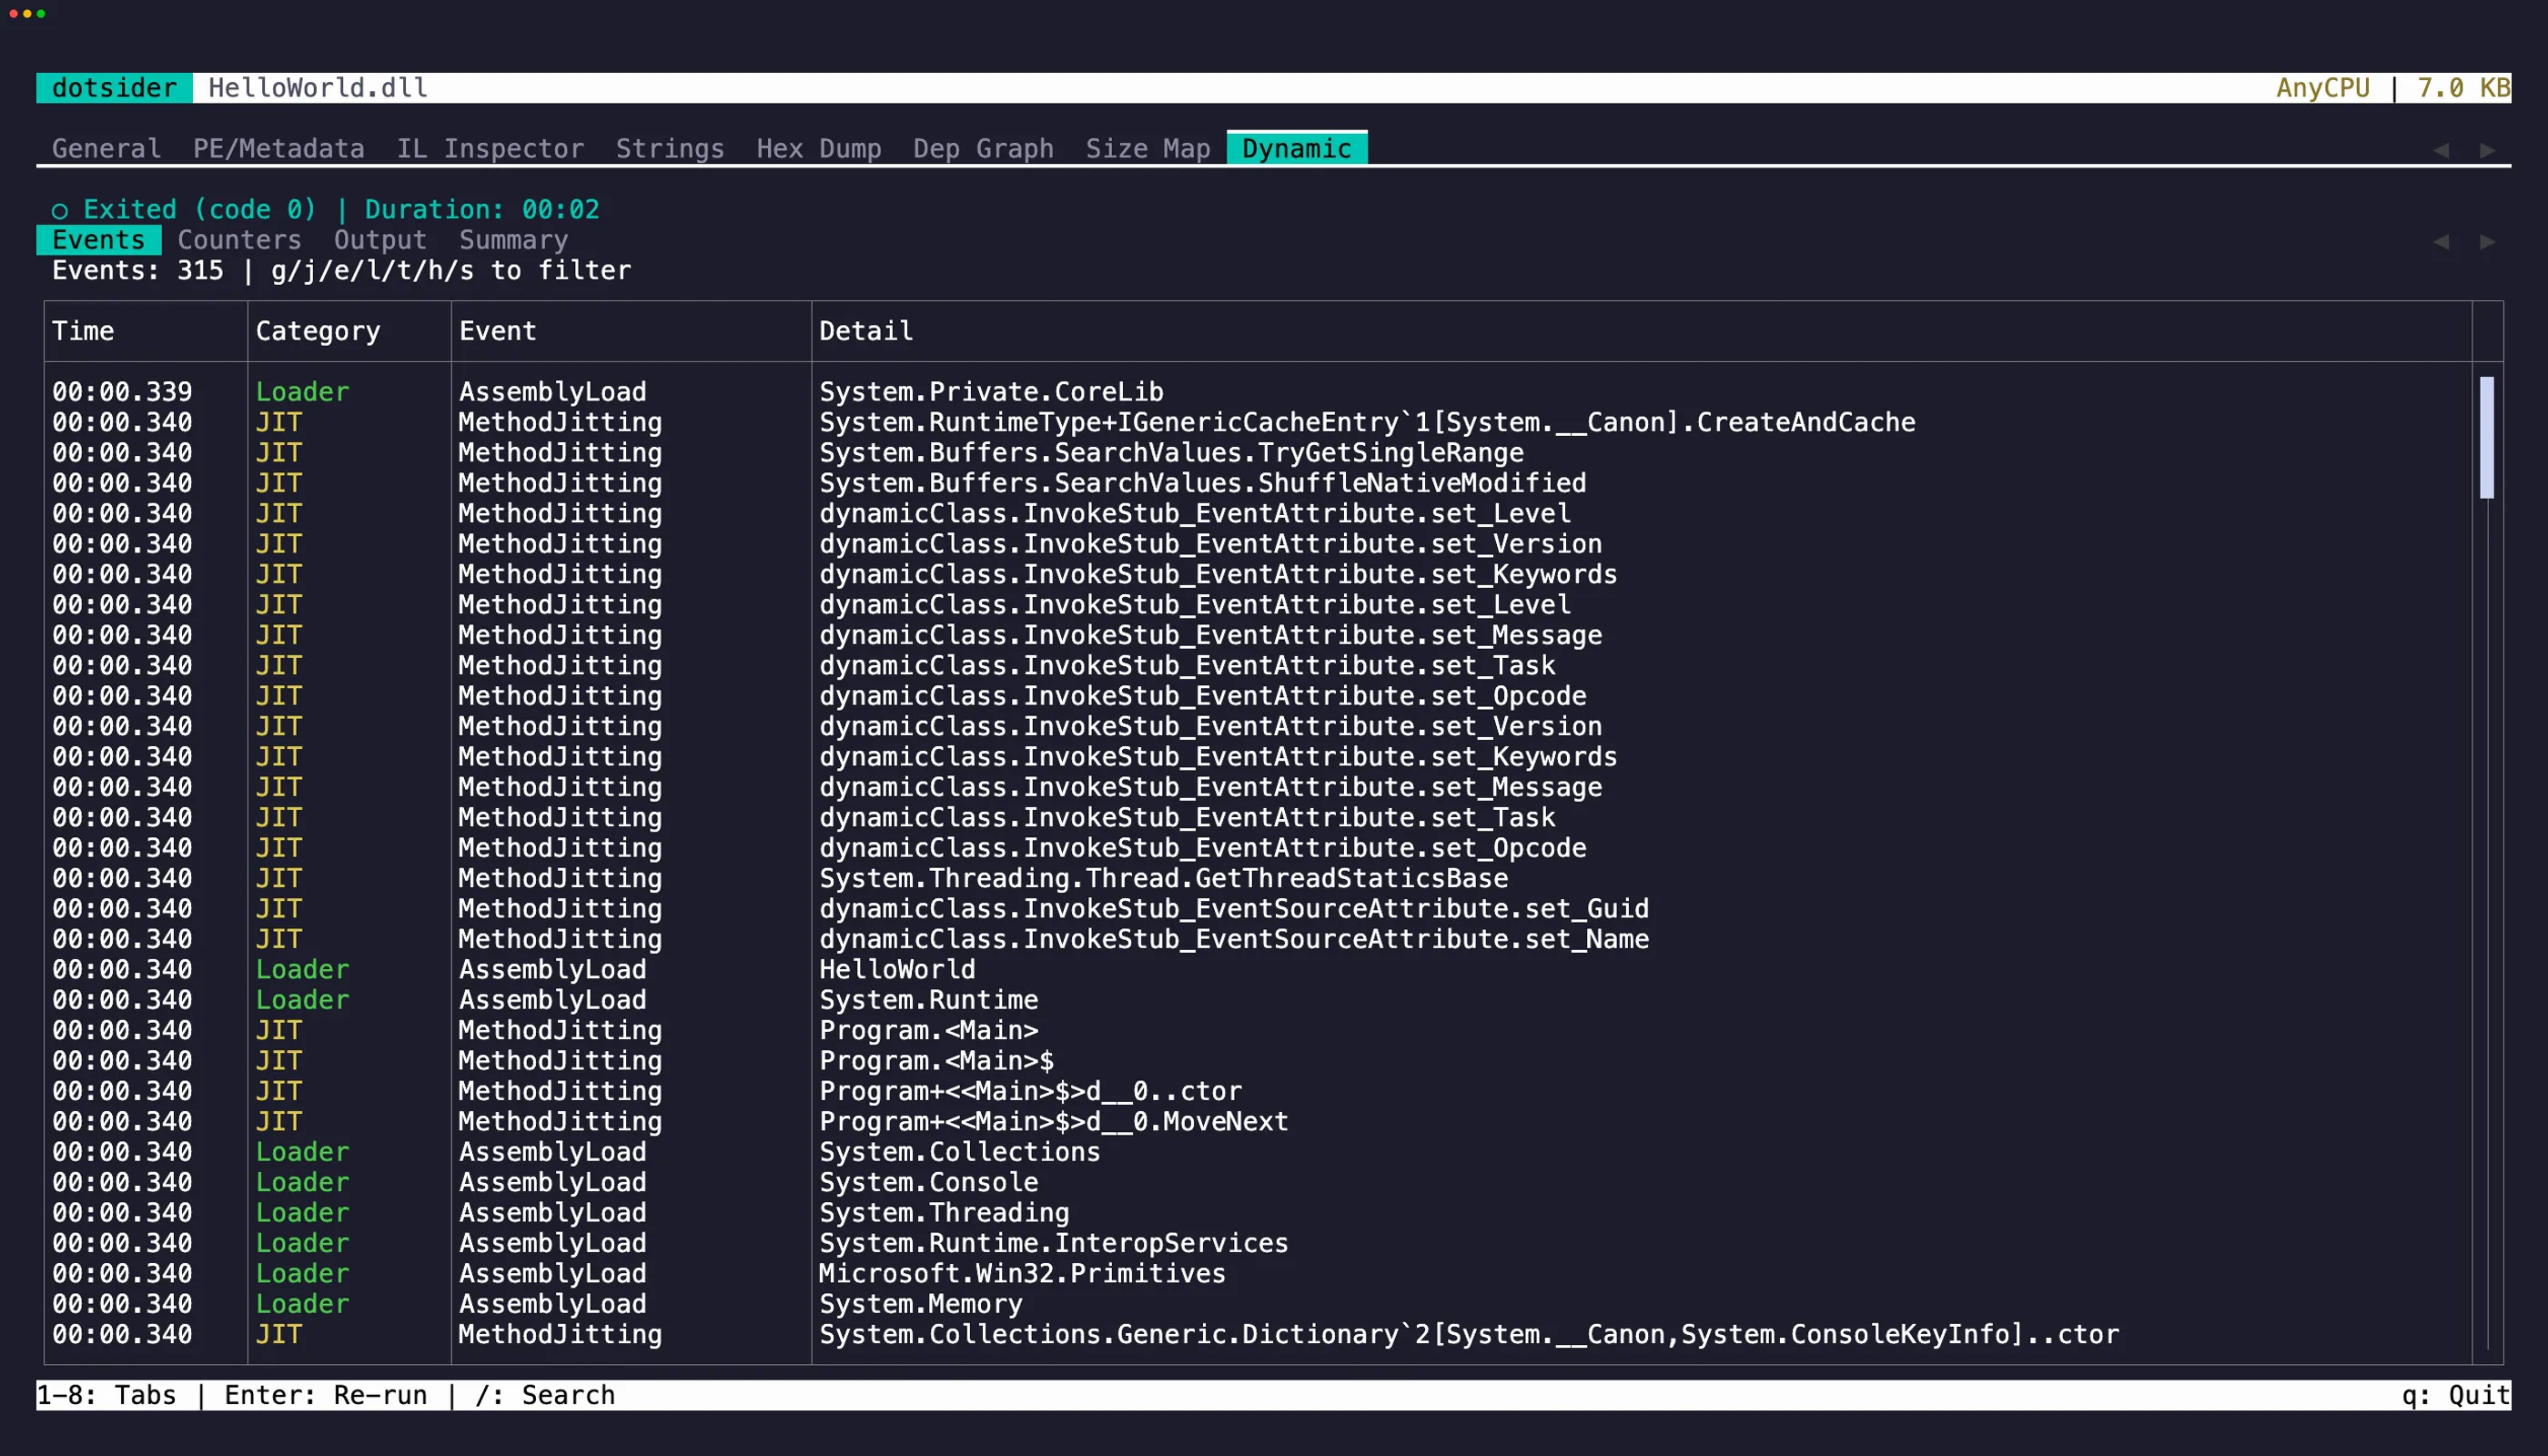
The Dynamic tab (8) launches the assembly and traces it in real time using EventPipe — the same diagnostic infrastructure behind dotnet-trace and dotnet-counters.
What it captures
Section titled “What it captures”- GC events — collections, heap sizes, pause durations
- JIT compilations — every method as it gets compiled, with timing
- Exceptions — first-chance and unhandled exceptions
- Performance counters — CPU, memory, thread pool, GC rates
- stdout / stderr — captured output from the running process
Cross-tab navigation
Section titled “Cross-tab navigation”Press Enter on a JIT compilation event to jump to that method’s IL disassembly in tab 3.
How it works
Section titled “How it works”dotsider launches the assembly with a reverse-connect diagnostic port, so events are captured from the very first instruction — nothing is missed during startup.