Dynamic
The Dynamic tab (8) launches the assembly and traces it in real time using EventPipe — the same diagnostic infrastructure behind dotnet-trace and dotnet-counters.
What it captures
Section titled “What it captures”- GC events — collections, heap sizes, pause durations
- JIT compilations — every method as it gets compiled, with timing
- Exceptions — first-chance and unhandled exceptions
- Performance counters — CPU, memory, thread pool, GC rates
- stdout / stderr — captured output from the running process
Sub-tabs
Section titled “Sub-tabs”The dynamic tab has four sub-tabs. Press Left / Right to switch between them.
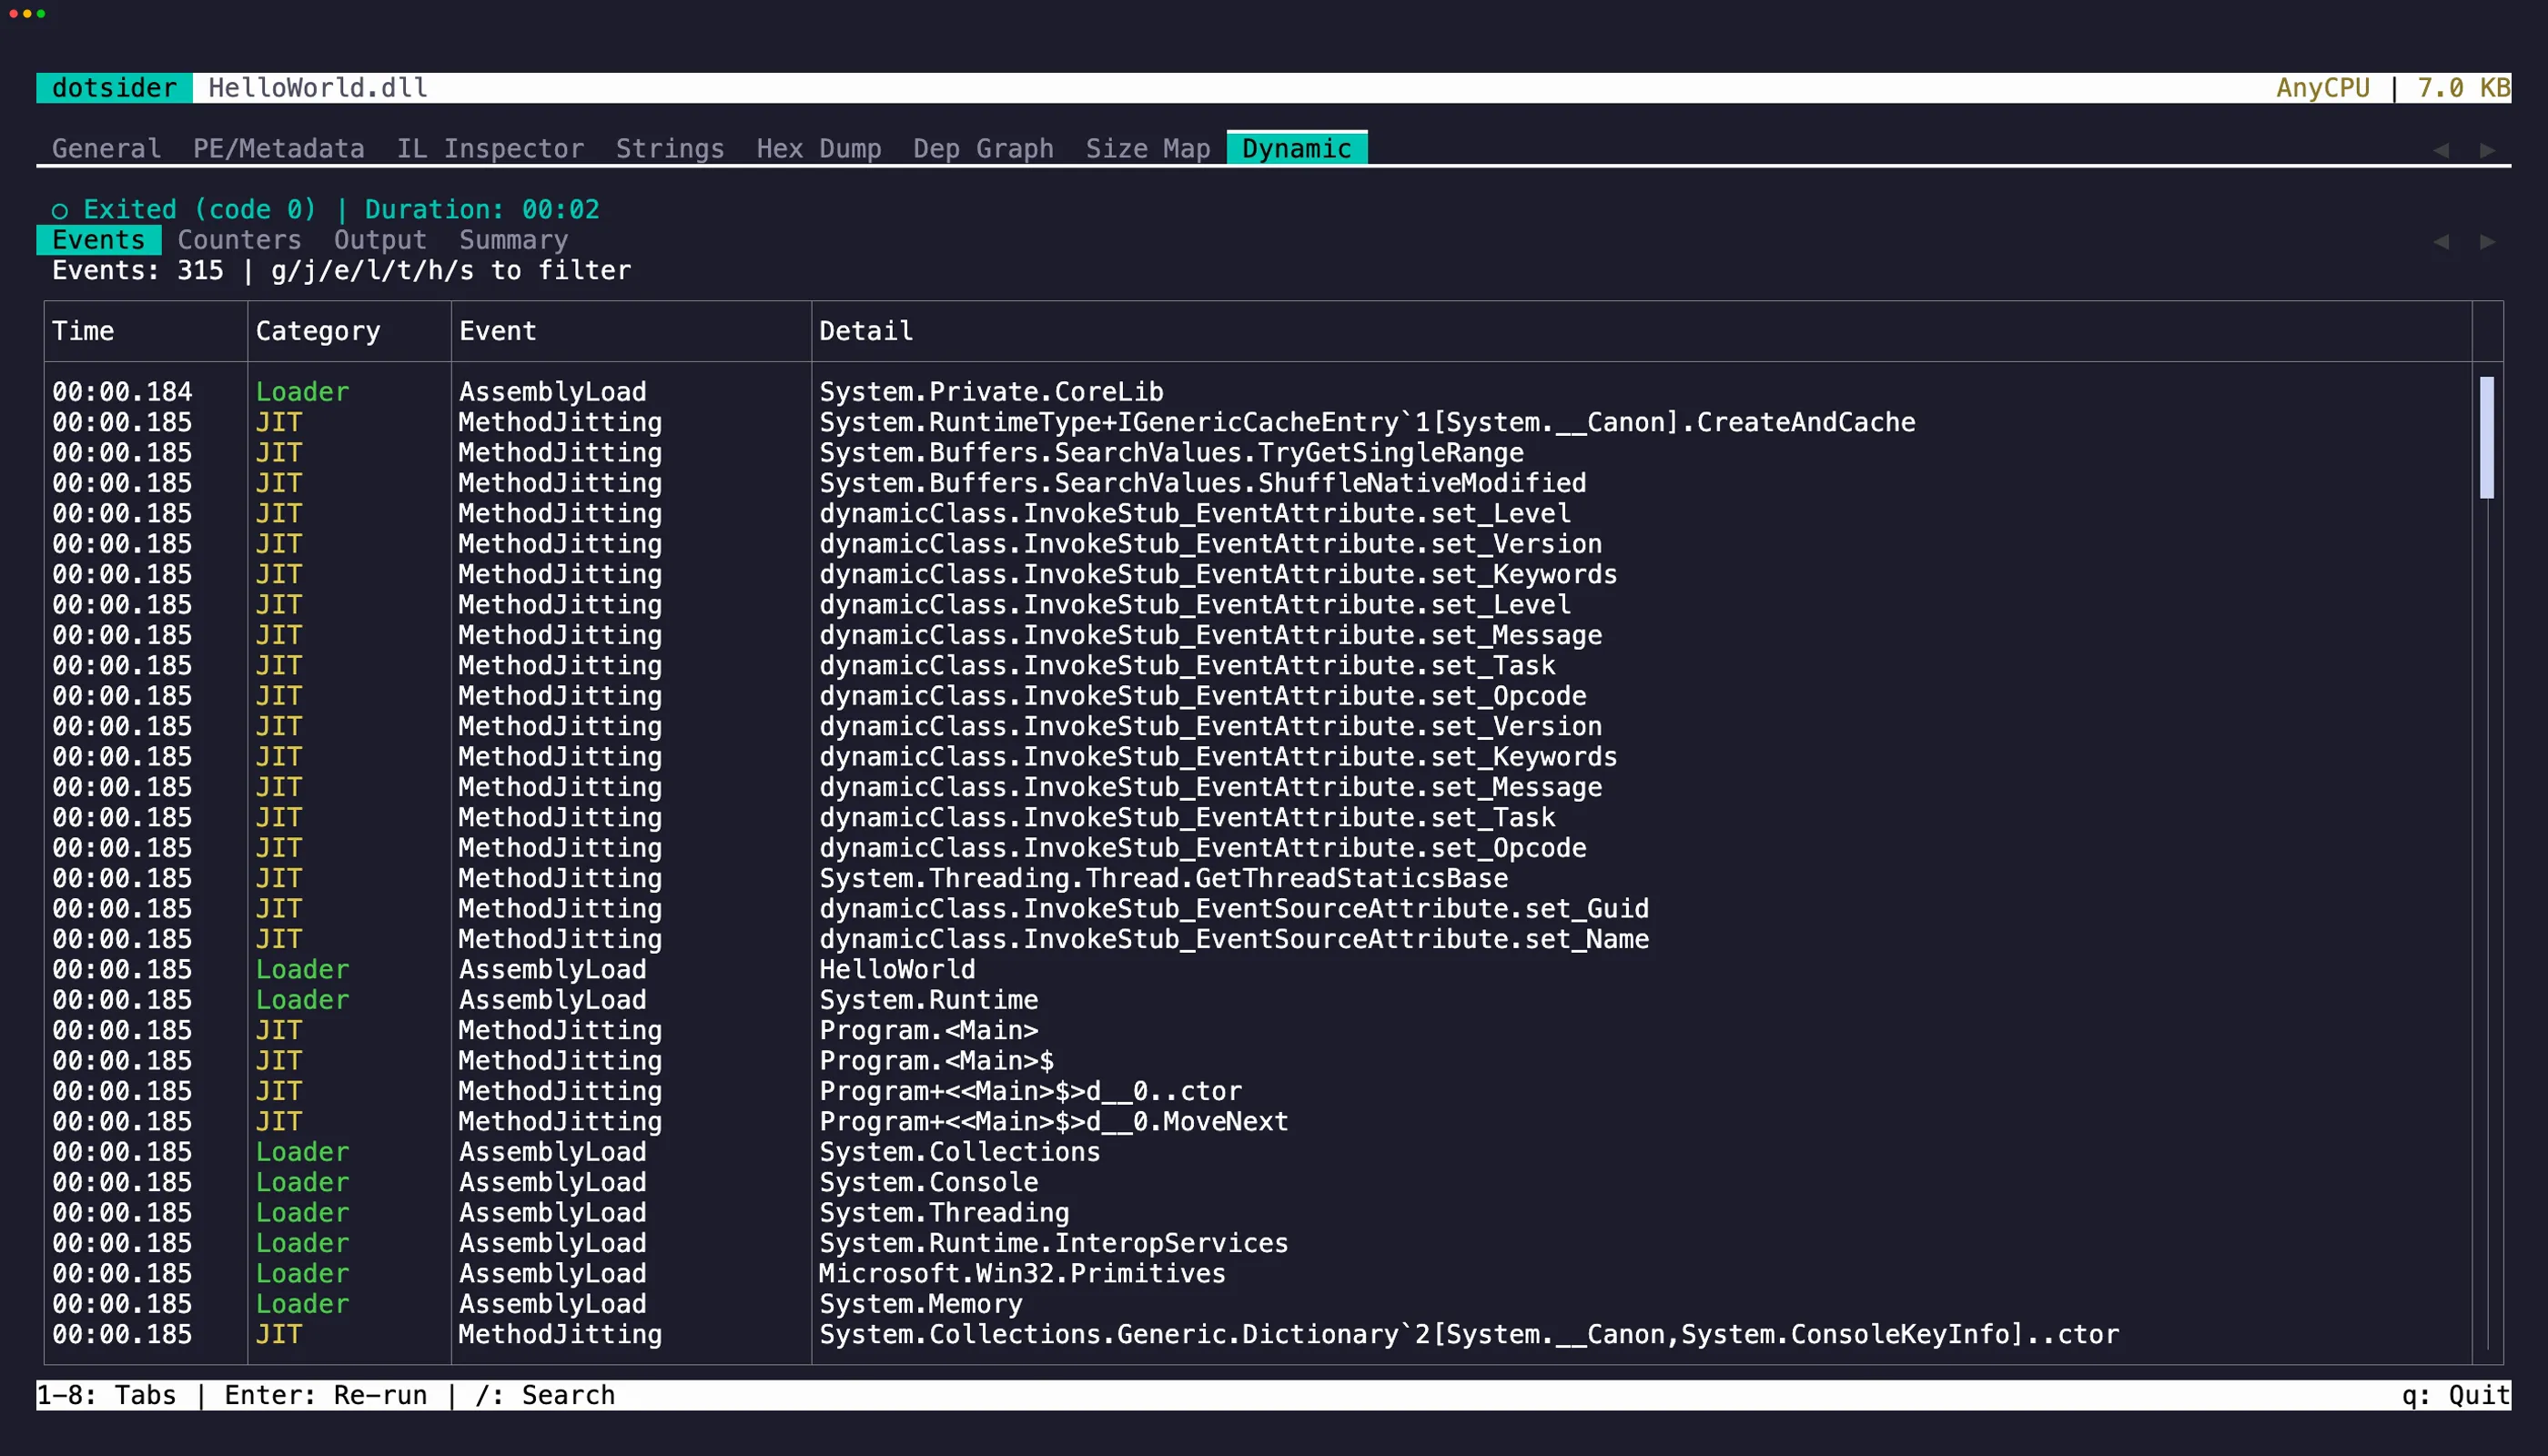
Events — a table of all trace events. Use the filter keys (g GC, j JIT, e Exception, l Loader, t Threading, h HTTP, s Socket) to narrow by category. Press Esc to clear the filter. Press / to search within events.
Counters — live performance counters in four sections: CPU, Memory, GC Collections, and Threading. Each section is a read-only editor — press Tab to cycle through them. Select text and press y to yank. iw, yiw, V, and yy all work. Counters update every ~1 second while the process is running.
Output — stdout and stderr from the traced process. stderr lines show in red. Press / to search output.
Summary — trace summary stats (total events, duration, jitted methods, GC collections, exceptions, peak memory) in a read-only editor with the same selection and yank support as Counters. Below it, an event distribution chart shows the breakdown by category.
Text selection and copy
Section titled “Text selection and copy”On the Events and Output tables, focus a row and press y to copy it to the clipboard. The focused row flashes briefly to confirm the yank.
On the Counters and Summary editors, select text with click-drag or Shift + arrow keys, then press y to copy. iw selects the word under the cursor, yiw copies it directly. V selects the line, yy copies it. Press Tab to cycle focus between editors (on Counters) or between the editor and the sub-tab strip.
Cross-tab navigation
Section titled “Cross-tab navigation”Press Enter on a JIT compilation event to jump to that method’s IL disassembly in tab 3.
Re-running
Section titled “Re-running”After the process exits, press Enter to re-run with the same arguments. Press a on the idle screen to set command-line arguments before launching.
How it works
Section titled “How it works”dotsider launches the assembly with a reverse-connect diagnostic port, so events are captured from the very first instruction — nothing is missed during startup.