Size Map
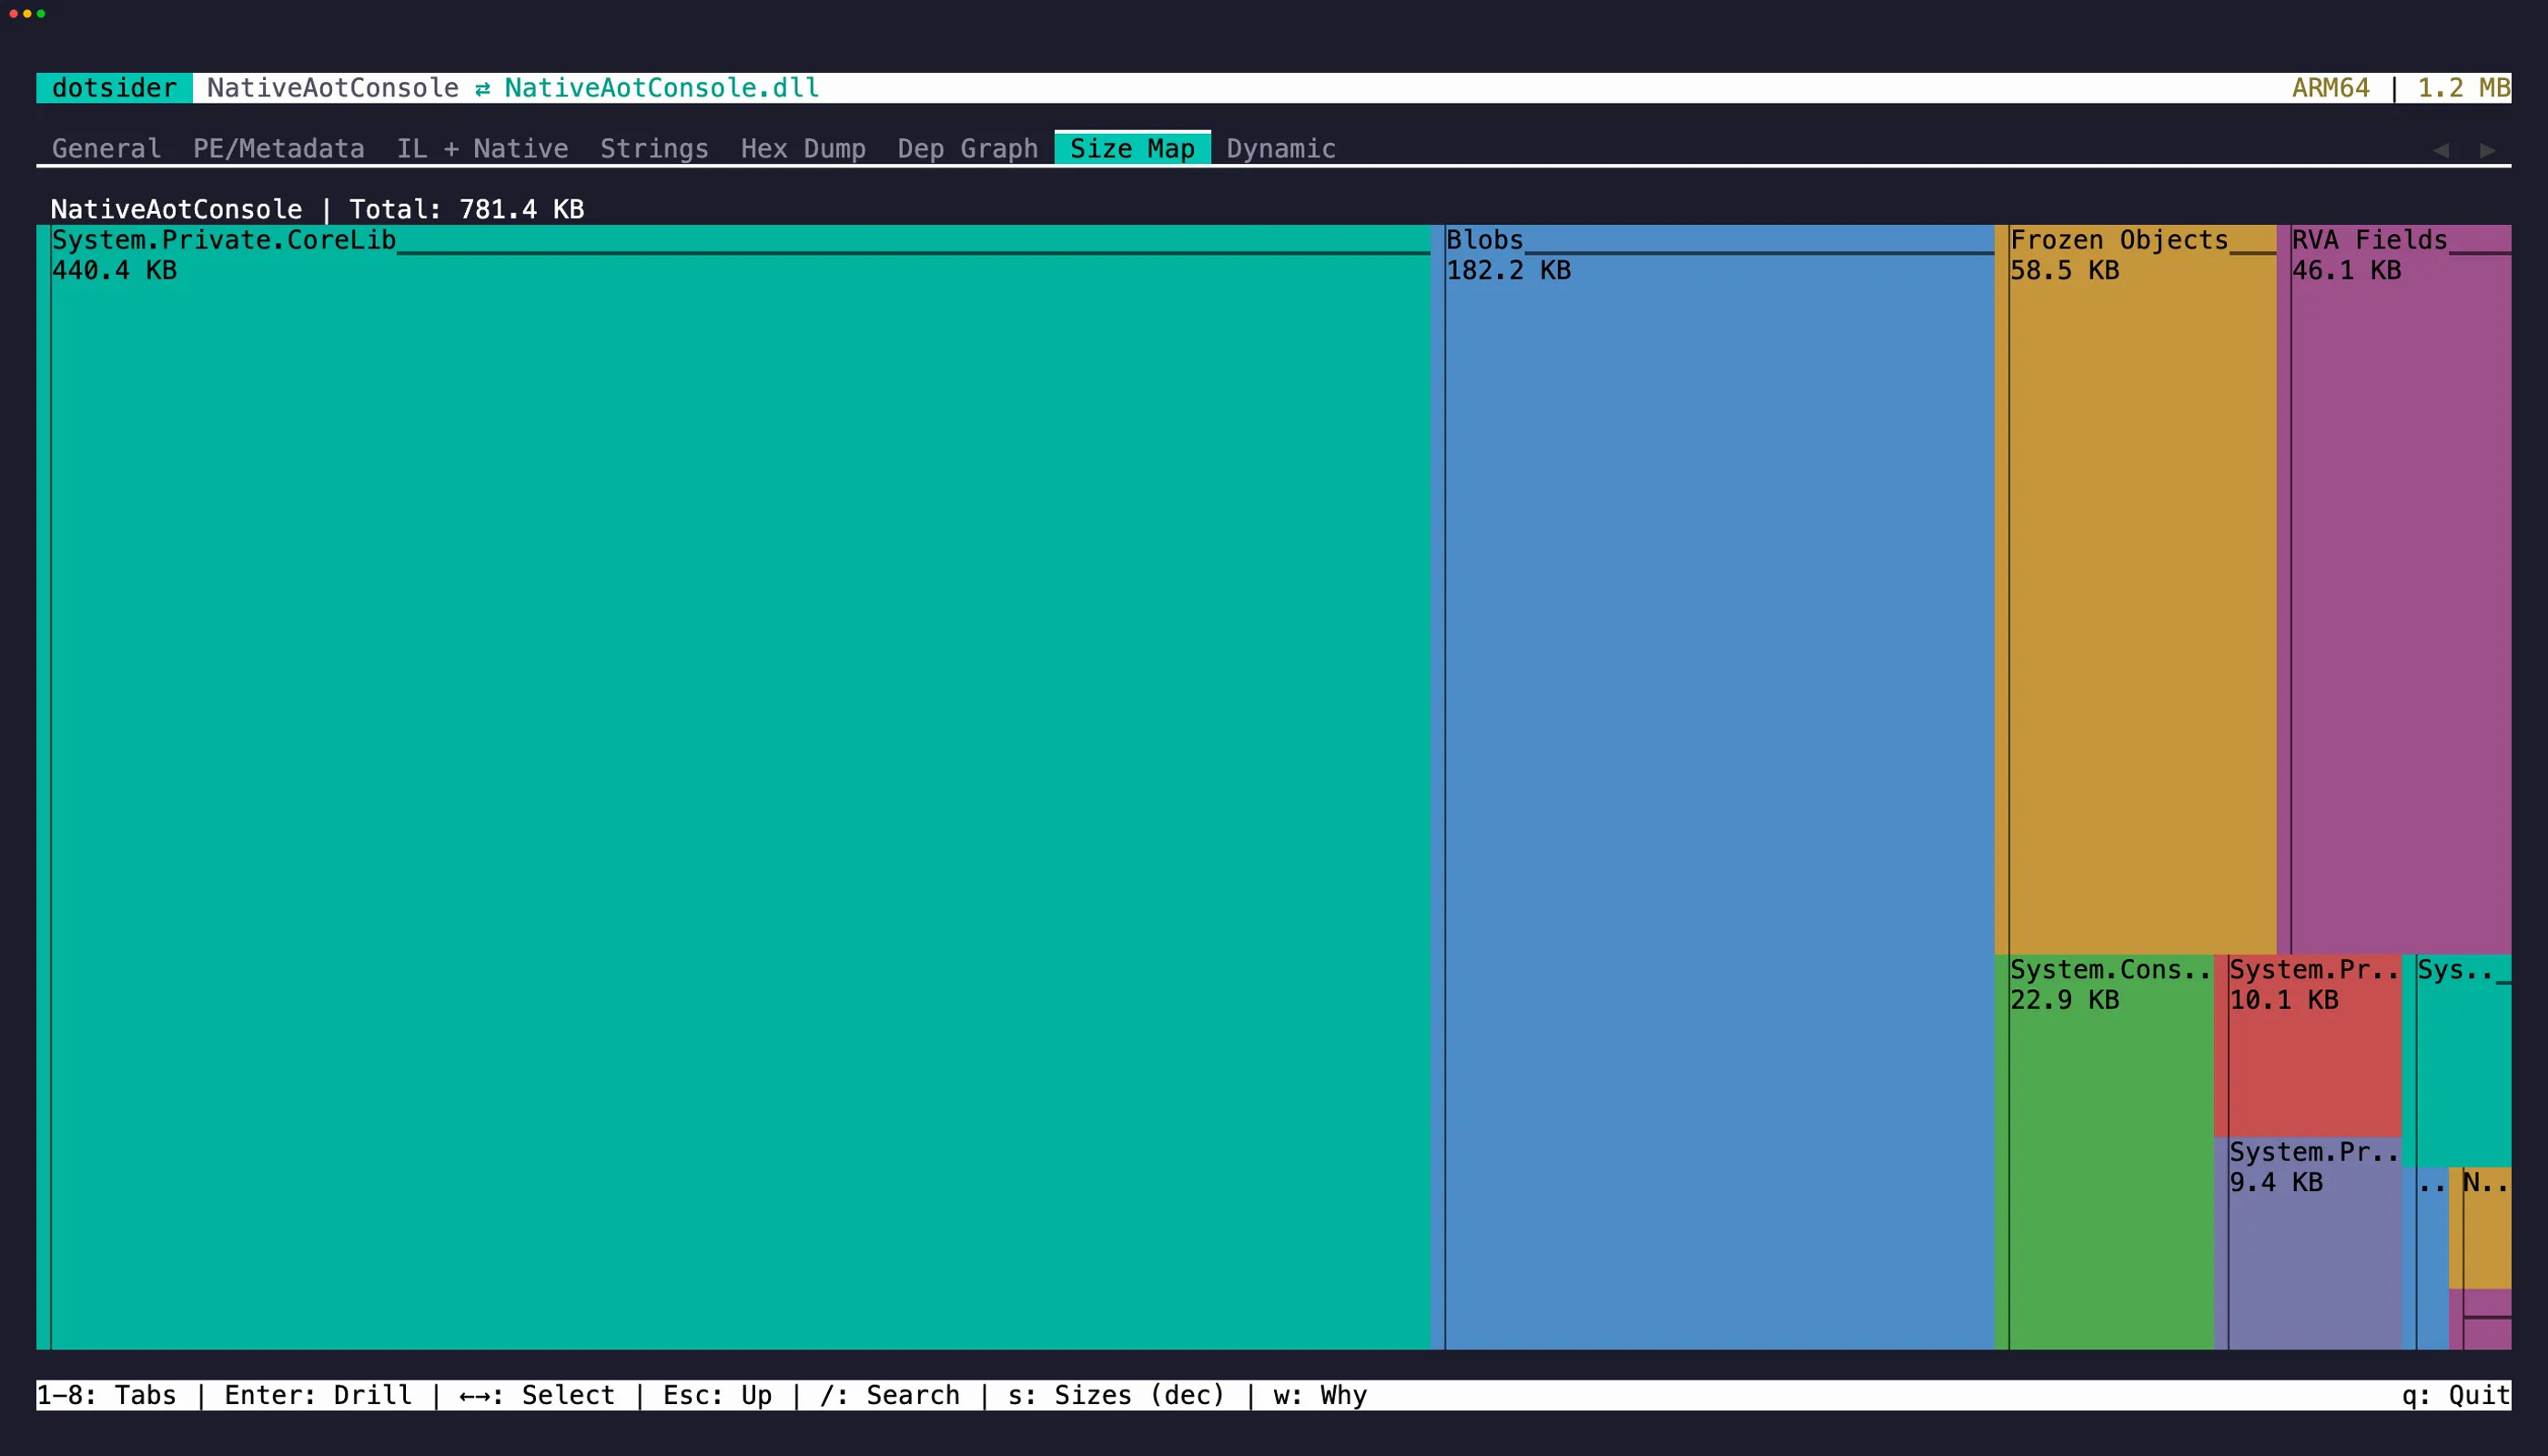
The Size Map tab (7) shows a treemap of IL code size:
- Assembly at the top level
- Namespaces as the first breakdown
- Types within each namespace
- Methods as leaf nodes, sized by IL byte count
Drill in
Section titled “Drill in”Click or press Enter on any region to drill into it. When you reach a method leaf, pressing Enter jumps to its IL disassembly in tab 3’s IL view.
This is useful for finding unexpectedly large methods or identifying which parts of your codebase contribute the most to assembly size.
Native AOT binaries
Section titled “Native AOT binaries”For a Native AOT binary the treemap is built from the compiler’s own size report instead of IL. Publish with two properties and copy the outputs next to the executable — ILC writes them to the native intermediate directory (obj/.../native/), not the publish folder:
<IlcGenerateMstatFile>true</IlcGenerateMstatFile><IlcGenerateDgmlFile>true</IlcGenerateDgmlFile>With the .mstat beside the binary the tree shows every assembly ILC compiled in, drilling through namespaces and types to native method sizes (code plus GC and exception info). Each type carries an explicit MethodTable leaf for its runtime type structure, and category regions sit beside the assemblies: Blobs for global data like embedded metadata and dispatch maps, Frozen Objects for compile-time allocated objects (mostly string literals), RVA Fields for data mapped straight into the image, and Resources for embedded manifest resources.
With the .codegen.dgml.xml beside the binary too, press w on any method, type, or frozen object to see why it is in the binary: the chain of dependencies from a root down to the node, each step annotated with the compiler’s reason. Esc dismisses the chain.
Without an mstat
Section titled “Without an mstat”When no .mstat sits beside a Native AOT binary, the treemap is built from its native symbols instead — the PDB, .dbg, or dSYM the publish produced. Functions joined to managed names group under assembly > namespace > type, and the compiler-generated data nodes land in explicit categories (MethodTables, Frozen Objects, Stubs, Generic Dictionaries, Statics, Data), with unjoined names under Runtime. The mstat report always wins when present — it is the compiler’s own accounting.
With no symbol file either, unwind data still yields nameless function boundaries under an Unattributed category — enough for a size histogram, though unwind data can miss leaf and thunk functions, so a boundary-only tree understates slightly.
ReadyToRun images
Section titled “ReadyToRun images”For a ReadyToRun (crossgen2) image the treemap sizes the precompiled native code — each method’s hot, funclet, and cold code ranges summed and grouped under assembly > namespace > type — rather than IL bytes, so the map reflects what crossgen2 actually emitted. Composite images group by the resolved component assembly metadata.
WebAssembly modules
Section titled “WebAssembly modules”For a raw dotnet.native.wasm module the treemap sizes the Wasm payload itself. The top level splits into function bodies, data segments, and remaining sections, with code/data section overhead called out separately. This is a file-size view of the SDK-produced runtime module, not a managed assembly size view.
For a Webcil app assembly such as _framework/MyApp.wasm, the treemap uses the managed IL view. The file is a WebAssembly-compatible container, but the code being analyzed is still ECMA-335 metadata and IL.
Comparing two builds
Section titled “Comparing two builds”To see where the bytes went between two AOT builds — the same treemap, but weighted by delta — see the size diff in Diff Mode and the CI gate in Size Regression.