IL Inspector
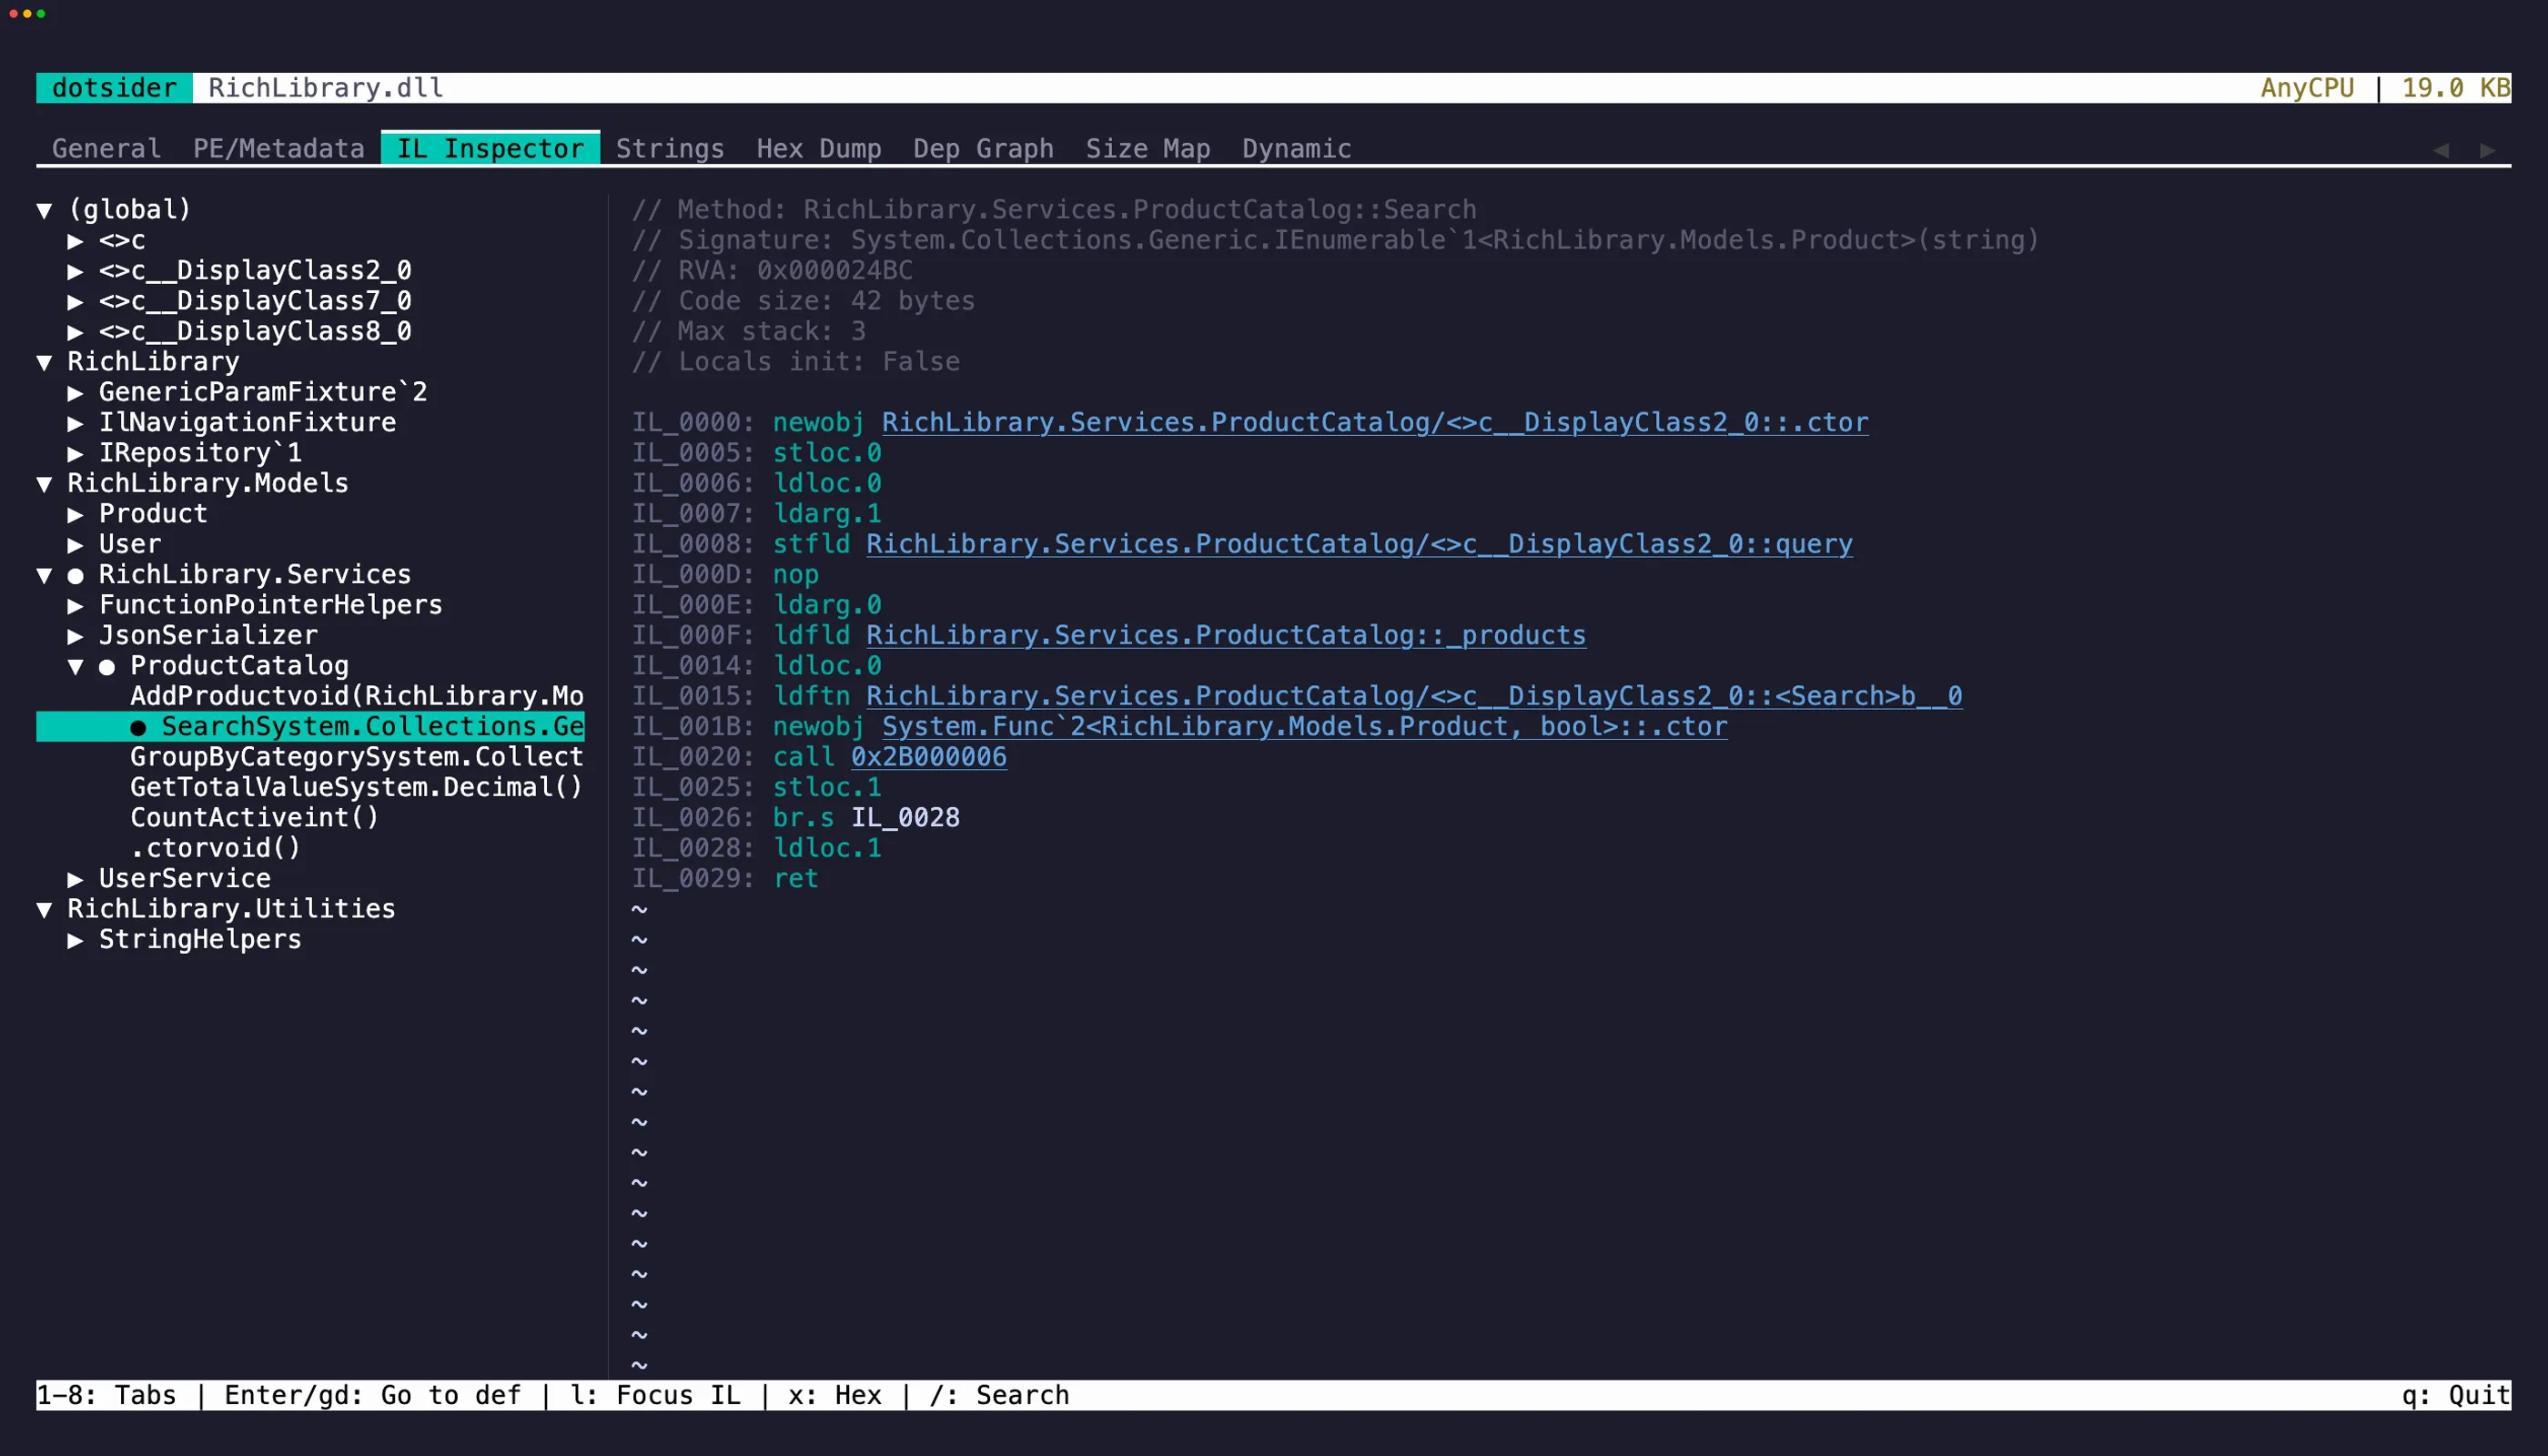
The IL Inspector tab (3) shows a tree of all namespaces, types, and methods. Select a method to see its IL bytecode in the right pane.
Each instruction shows:
- Offset — byte offset within the method body
- Opcode — the IL instruction
- Operand — decoded metadata tokens, string literals, branch targets
When a portable PDB is available, the disassembly also shows PDB provenance, source spans, Source Link markers, and local variable names. Press u on a [source link] marker to copy the resolved URL. Embedded source documents can be opened from selected methods.
Go to definition
Section titled “Go to definition”Press Enter or gd while the cursor is on a token-bearing instruction (call, callvirt, newobj, ldfld, castclass, etc.) to navigate to the target. Navigable operands are underlined.
- Local methods open their disassembly directly.
- External methods resolve the referenced assembly and open it. Reference assemblies like
System.Runtimethat contain no IL are automatically mapped to their implementation (System.Private.CoreLib). Resolution probes the app directory, the .NET shared framework, and any single-file bundles in scope. - Fields show the field signature, declaring type, and attributes in the right pane.
- Generic instantiations (
List<int>,Task<string>) unwrap to the underlying open generic type.
Press Esc to go back. The previous IL bytecode, cursor position, tree expansion state, and scroll position are all restored. You can chain multiple jumps and unwind them one at a time.
Cross-tab navigation
Section titled “Cross-tab navigation”- Press
xon a selected method to jump to its body in the Hex Dump tab. The hex view scrolls to the method’s RVA. - Press
oon a selected method to open embedded source when the PDB carries it. - Press
Escto return to where you came from.
Select text in the disassembly pane with click-drag or Shift + arrow keys, then press y to yank it to the clipboard. The cursor collapses to the end of the selection and a brief flash confirms the copied range — matching neovim’s yank behavior.
iw selects the word under the cursor (an opcode, a token, a label). yiw copies it directly. iW grabs the full whitespace-delimited token, which is useful for qualified names in operands. V selects the entire instruction line and yy copies it directly.
Search
Section titled “Search”Press / to search method names or IL content. Matches are highlighted in both the tree and disassembly panes.